|
The
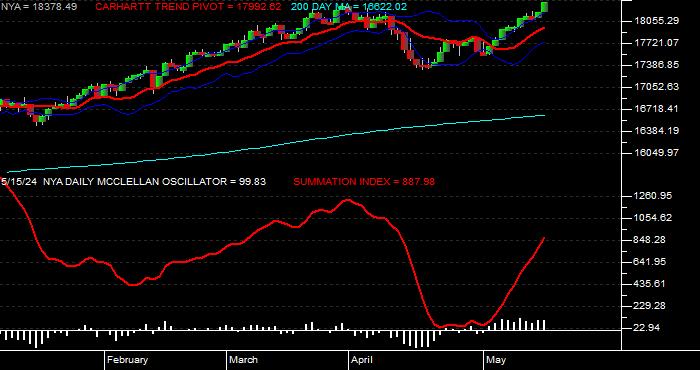
Carhartt Trend Pivot (Pivot
Line)
is a proprietary trend indicatory developed by Larry Carhartt
when trading the Treasury Bond futures markets in the 1990's.
In a trending market, a closing price above this line indicates
an uptrend. Conversely, a closing price below this
line indicates a downtrend.
The McClellan
Oscillator
is a market breadth indicator based upon the smoothed difference
between the number of advancing and declining issues on
the index or ETF.
The McClellan
Summation Index
is a market breath indicator based on an accumulation of
the McClellan Oscillator (see description immediately above).
The McClellan Summation Index is a long-term version of
the McClellan Oscillator. Its interpretation is similar
to that of the McClellan Oscillator except that it is more
suited to major trend reversals.
|